test patch D49540
patch link: D49540
Contents
VM environment with a 1GE switch
single path testbed
Virtual machines (VMs) as TCP traffic senders using iperf3 are hosted by Bhyve in a physical box (Beelink SER5 AMD Mini PC). This box uses FreeBSD 14.2 release. Another box that is the same type uses Ubuntu Linux desktop version. The two boxes are connected through a 5-Port Gigabit Ethernet Switch (TP-Link TL-SG105). The switch has a shared 1Mb (125KB) Packet Buffer Memory.
functionality show case
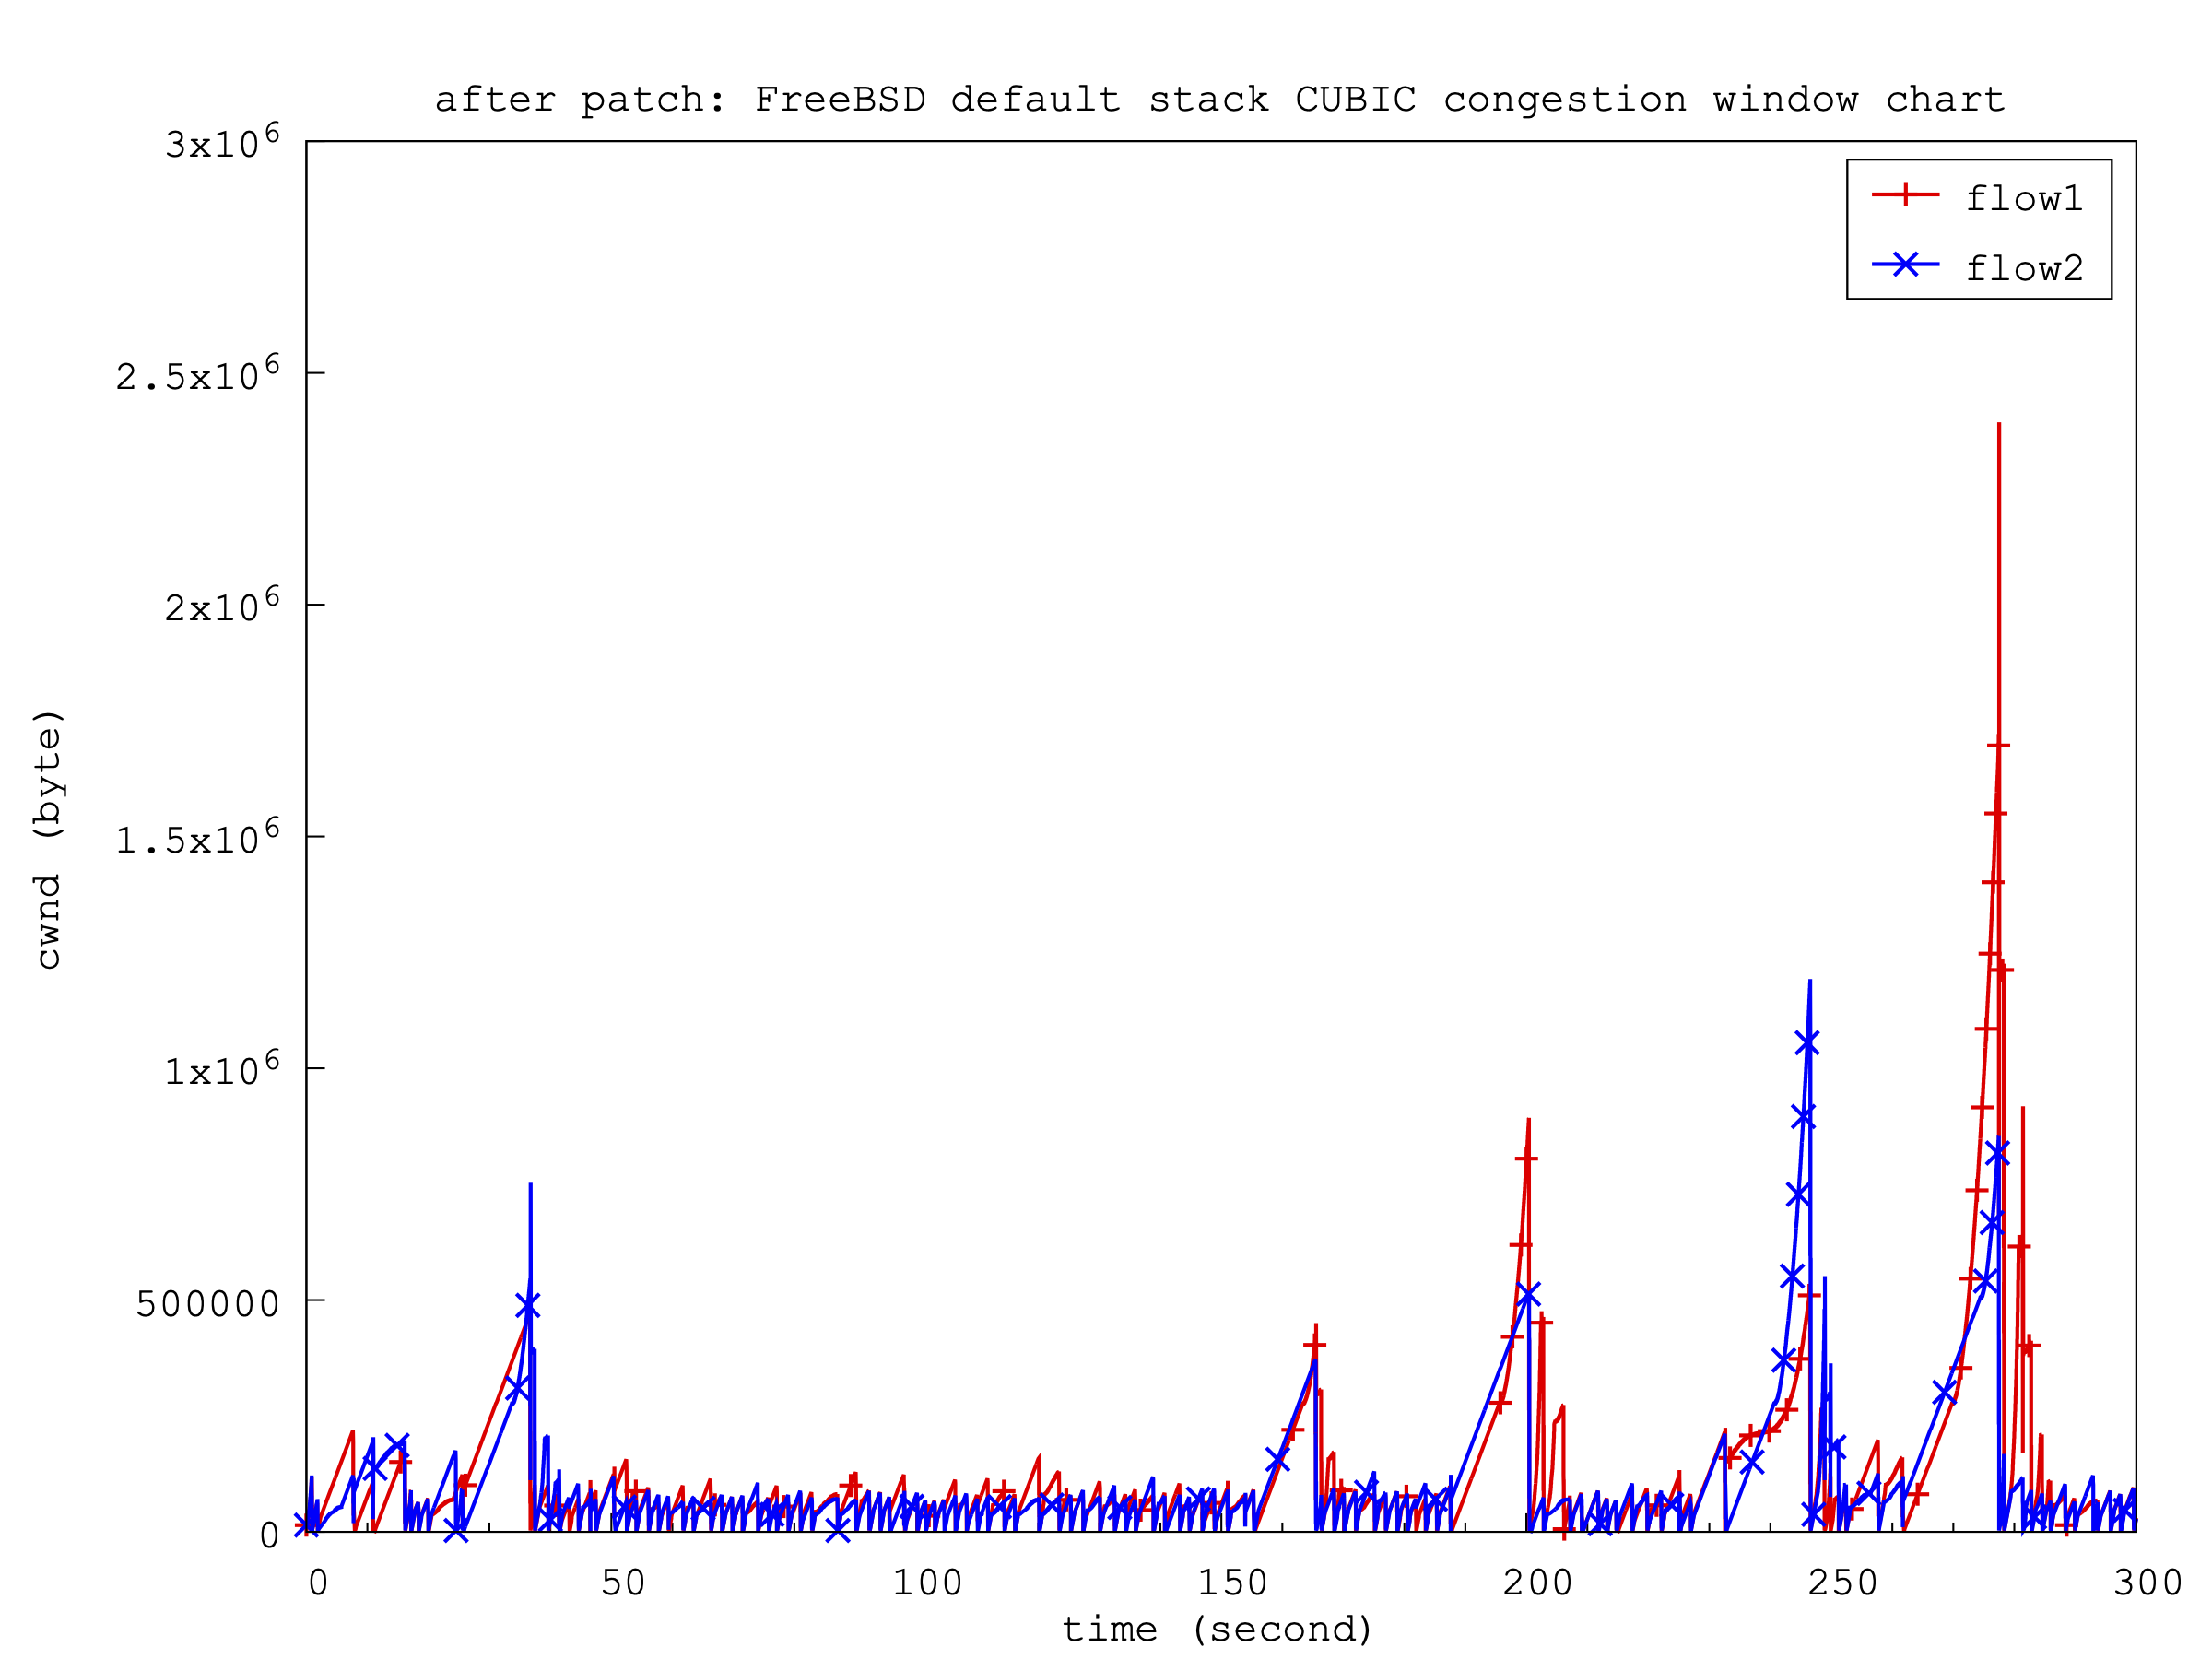
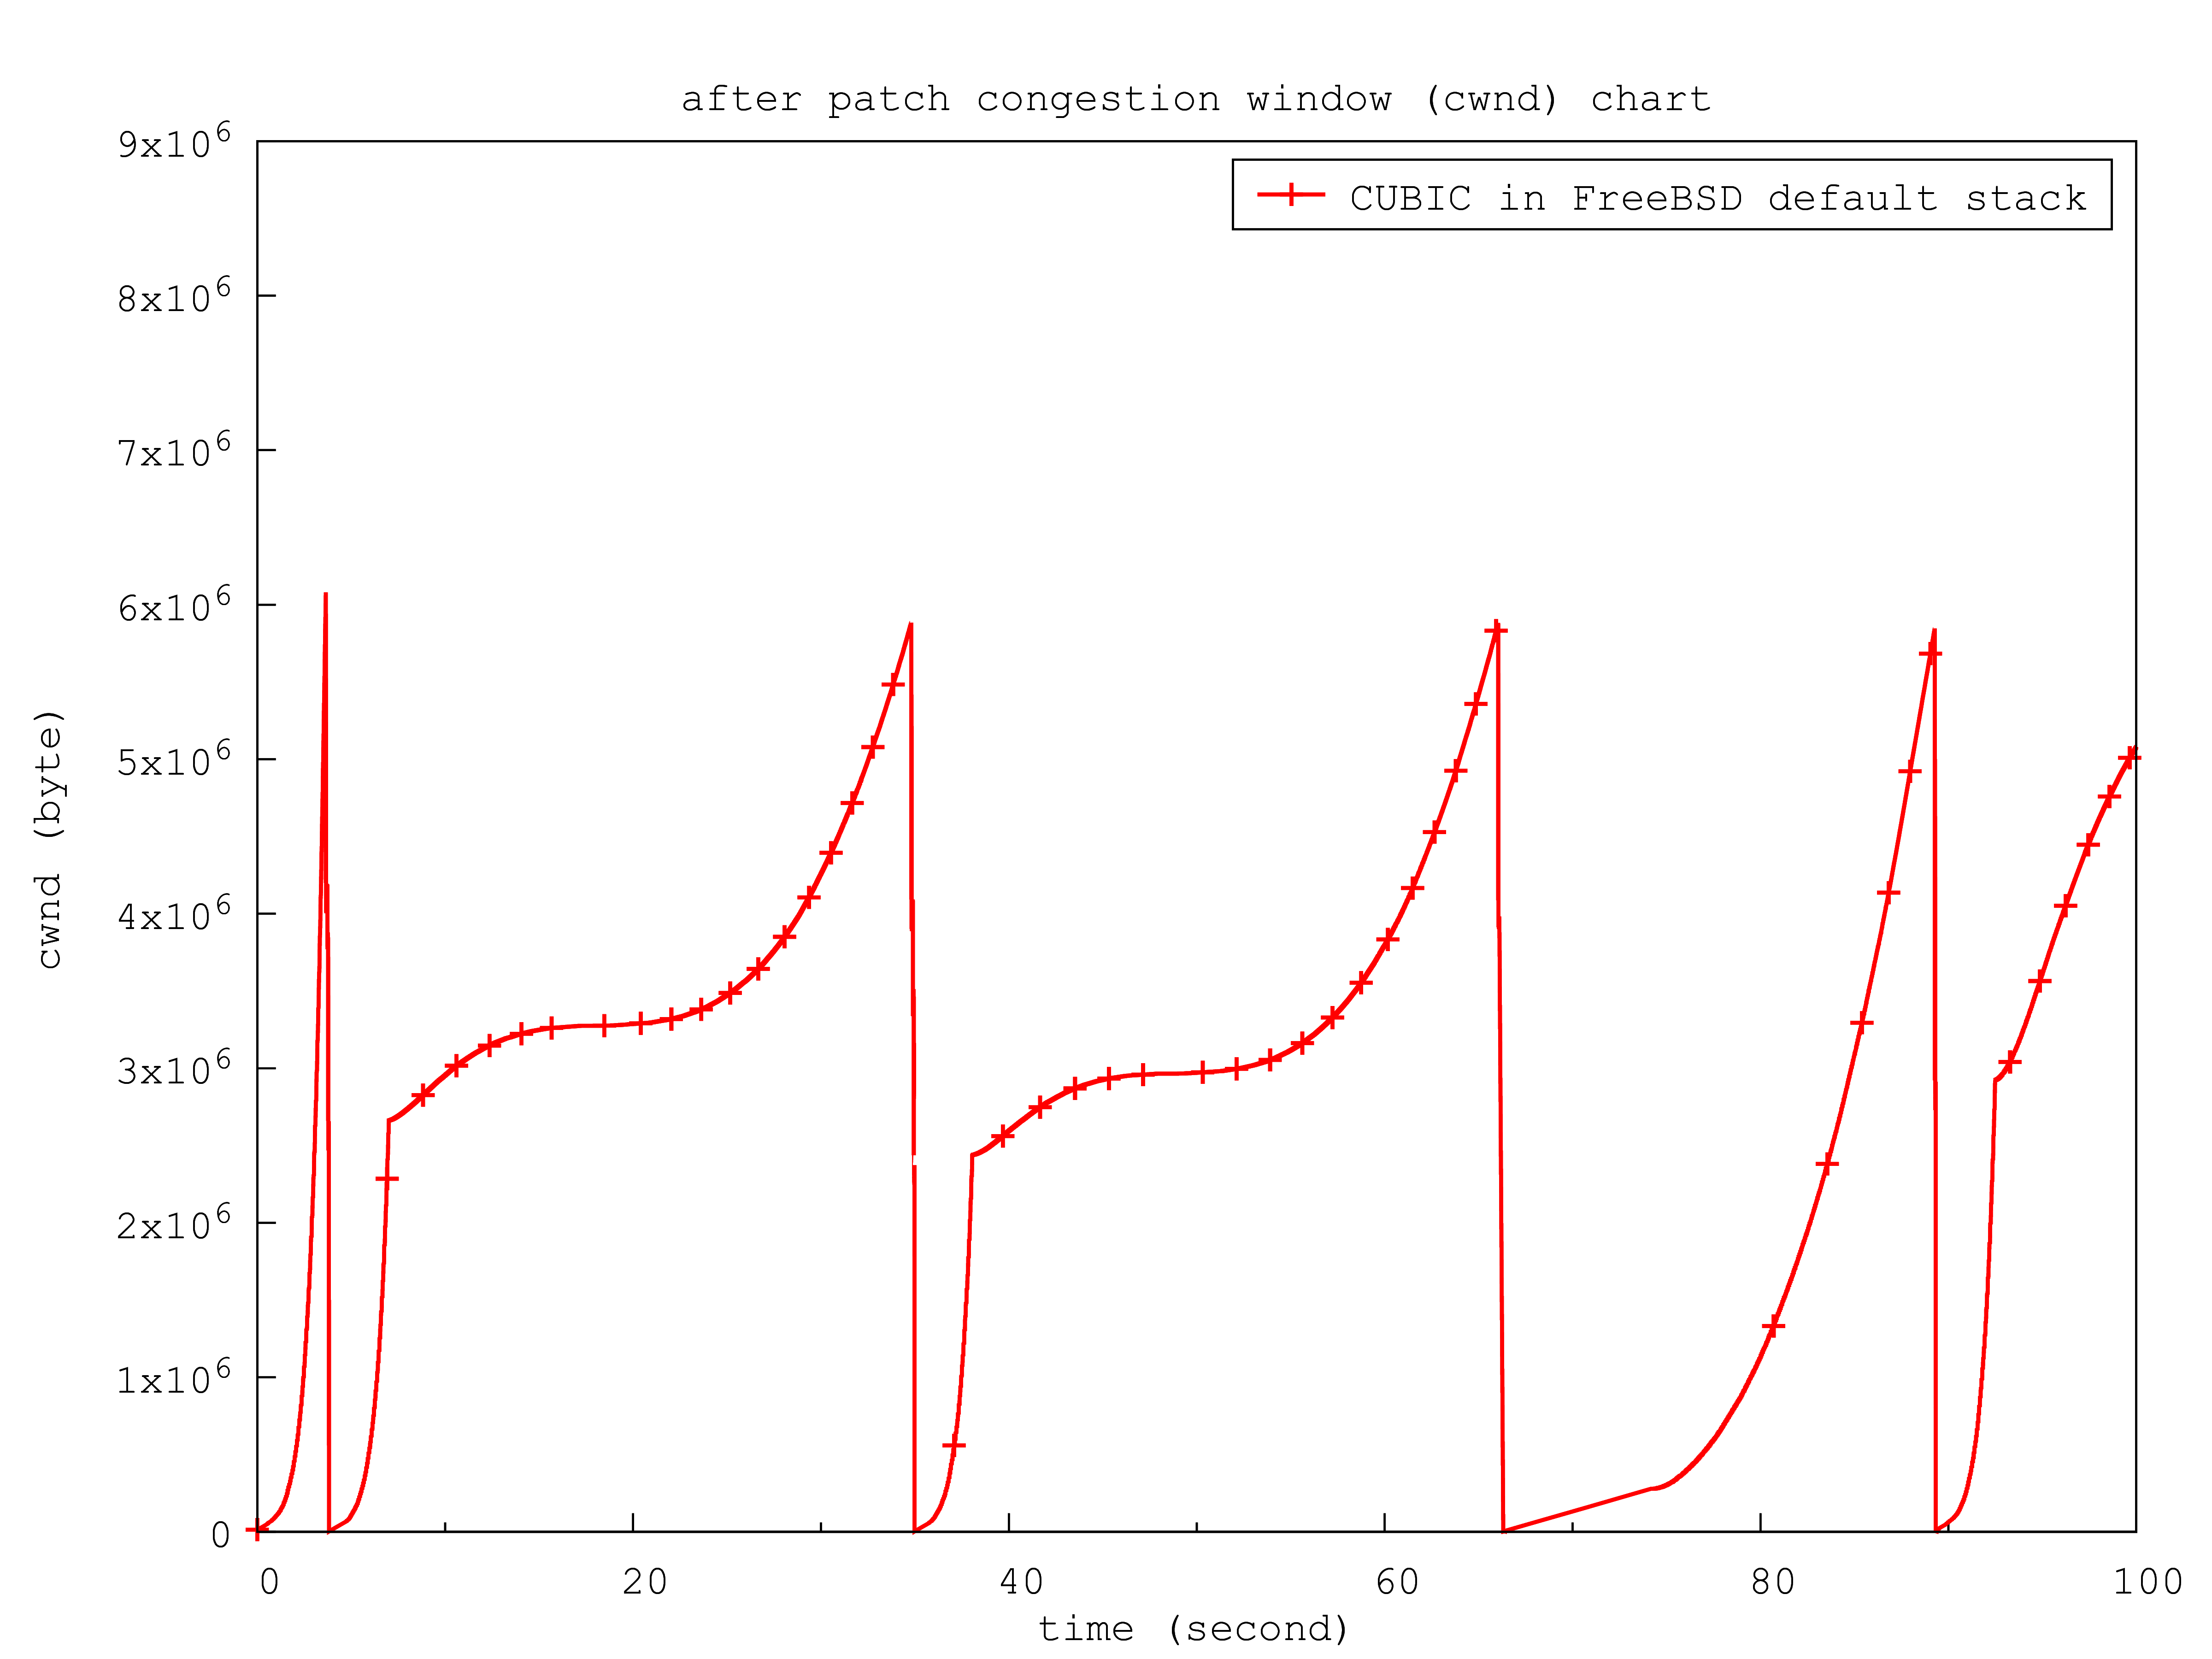
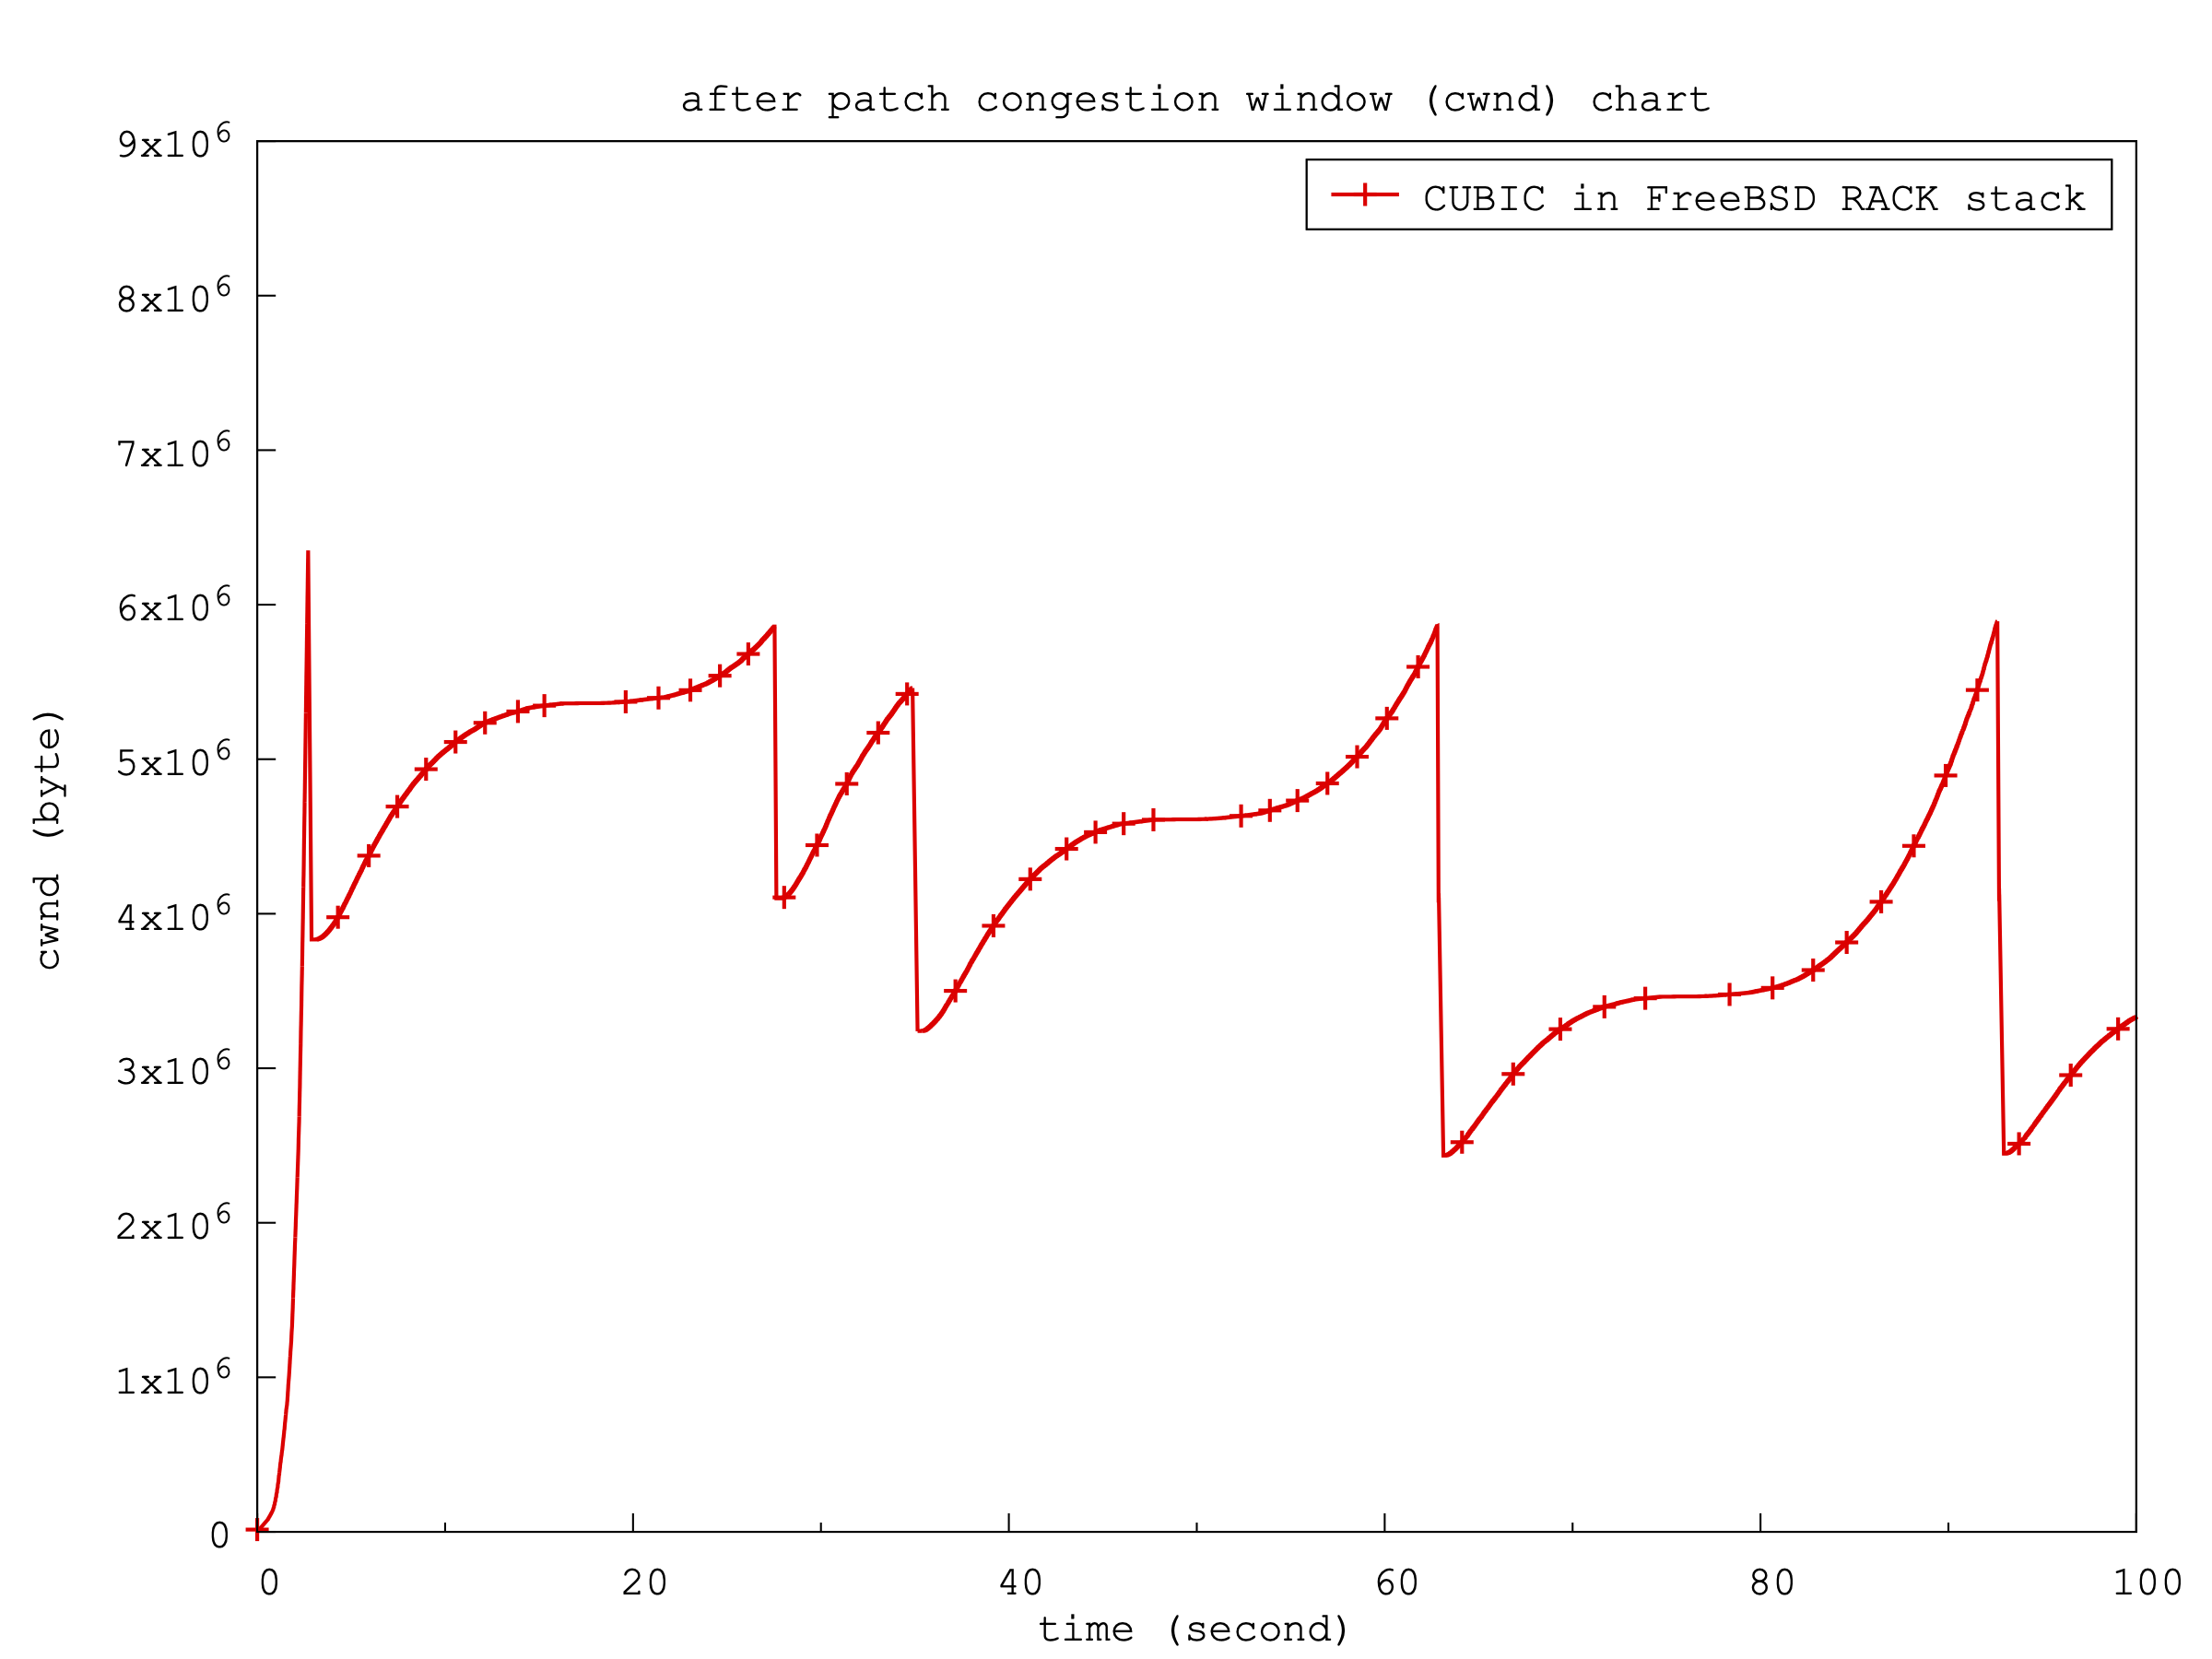
This test will show a general TCP congestion control window (cwnd) growth pattern before/after the patch. And also compare with the cwnd growth pattern from the Linux kernel.
- additional 40ms latency is added/emulated in the receiver (Ubuntu Linux with traffic shaping: The minimum bandwidth delay product (BDP) is 1000Mbps x 40ms == 5 Mbytes. So I configured sender/receiver with 10MB buffer.)
cc@Linux:~ % sudo tc qdisc add dev enp1s0 root netem delay 40ms
cc@Linux:~ % tc qdisc show dev enp1s0
qdisc netem 8001: root refcnt 2 limit 1000 delay 40ms
cc@Linux:~ %

root@n1fbsd:~ # ping -c 4 -S n1fbsd Linux
PING Linux (192.168.50.46) from n1fbsdvm: 56 data bytes
64 bytes from 192.168.50.46: icmp_seq=0 ttl=64 time=41.053 ms
64 bytes from 192.168.50.46: icmp_seq=1 ttl=64 time=41.005 ms
64 bytes from 192.168.50.46: icmp_seq=2 ttl=64 time=41.011 ms
64 bytes from 192.168.50.46: icmp_seq=3 ttl=64 time=41.168 ms

--- Linux ping statistics ---
4 packets transmitted, 4 packets received, 0.0% packet loss
round-trip min/avg/max/stddev = 41.005/41.059/41.168/0.066 ms
root@n1fbsd:~ #

root@n1ubuntu24:~ # ping -c 4 -I 192.168.50.161 Linux
PING Linux (192.168.50.46) from 192.168.50.161 : 56(84) bytes of data.
64 bytes from Linux (192.168.50.46): icmp_seq=1 ttl=64 time=40.9 ms
64 bytes from Linux (192.168.50.46): icmp_seq=2 ttl=64 time=40.9 ms
64 bytes from Linux (192.168.50.46): icmp_seq=3 ttl=64 time=41.0 ms
64 bytes from Linux (192.168.50.46): icmp_seq=4 ttl=64 time=41.1 ms

--- Linux ping statistics ---
4 packets transmitted, 4 received, 0% packet loss, time 3061ms
rtt min/avg/max/mdev = 40.905/40.981/41.108/0.078 ms
root@n1ubuntu24:~ #

root@n1fbsd:~ # sysctl -f /etc/sysctl.conf
net.inet.tcp.hostcache.enable: 0 -> 0
kern.ipc.maxsockbuf: 10485760 -> 10485760
net.inet.tcp.sendbuf_max: 10485760 -> 10485760
net.inet.tcp.recvbuf_max: 10485760 -> 10485760
root@n1fbsd:~ #

root@n1ubuntu24:~ # sysctl -p
net.core.rmem_max = 10485760
net.core.wmem_max = 10485760
net.ipv4.tcp_rmem = 4096 131072 10485760
net.ipv4.tcp_wmem = 4096 16384 10485760
net.ipv4.tcp_no_metrics_save = 1
root@n1ubuntu24:~ #

cc@Linux:~ % sudo sysctl -p
net.core.rmem_max = 10485760
net.core.wmem_max = 10485760
net.ipv4.tcp_rmem = 4096 131072 10485760
net.ipv4.tcp_wmem = 4096 16384 10485760
net.ipv4.tcp_no_metrics_save = 1
cc@Linux:~ %
- info for switching to the FreeBSD RACK TCP stack
root@n1fbsd:~ # kldstat
Id Refs Address                Size Name
 1    5 0xffffffff80200000  1f75ca0 kernel
 2    1 0xffffffff82810000    368d8 tcp_rack.ko
 3    1 0xffffffff82847000     f0f0 tcphpts.ko
root@n1fbsd:~ # sysctl net.inet.tcp.functions_default=rack
net.inet.tcp.functions_default: freebsd -> rack
root@n1fbsd:~ #
FreeBSD VM sender info |
FreeBSD 15.0-CURRENT (GENERIC) #0 main-6f6c07813b38: Fri Mar 21 2025 |
Linux VM sender info |
Ubuntu server 24.04.2 LTS (GNU/Linux 6.8.0-55-generic x86_64) |
Linux receiver info |
Ubuntu desktop 24.04.2 LTS (GNU/Linux 6.11.0-19-generic x86_64) |
- iperf3 command
receiver: iperf3 -s -p 5201 --affinity 1
sender:   iperf3 -B ${src} --cport ${tcp_port} -c ${dst} -p 5201 -l 1M -t 300 -i 1 -f m -VC ${name}
CUBIC growth pattern before/after patch in FreeBSD default stack: 
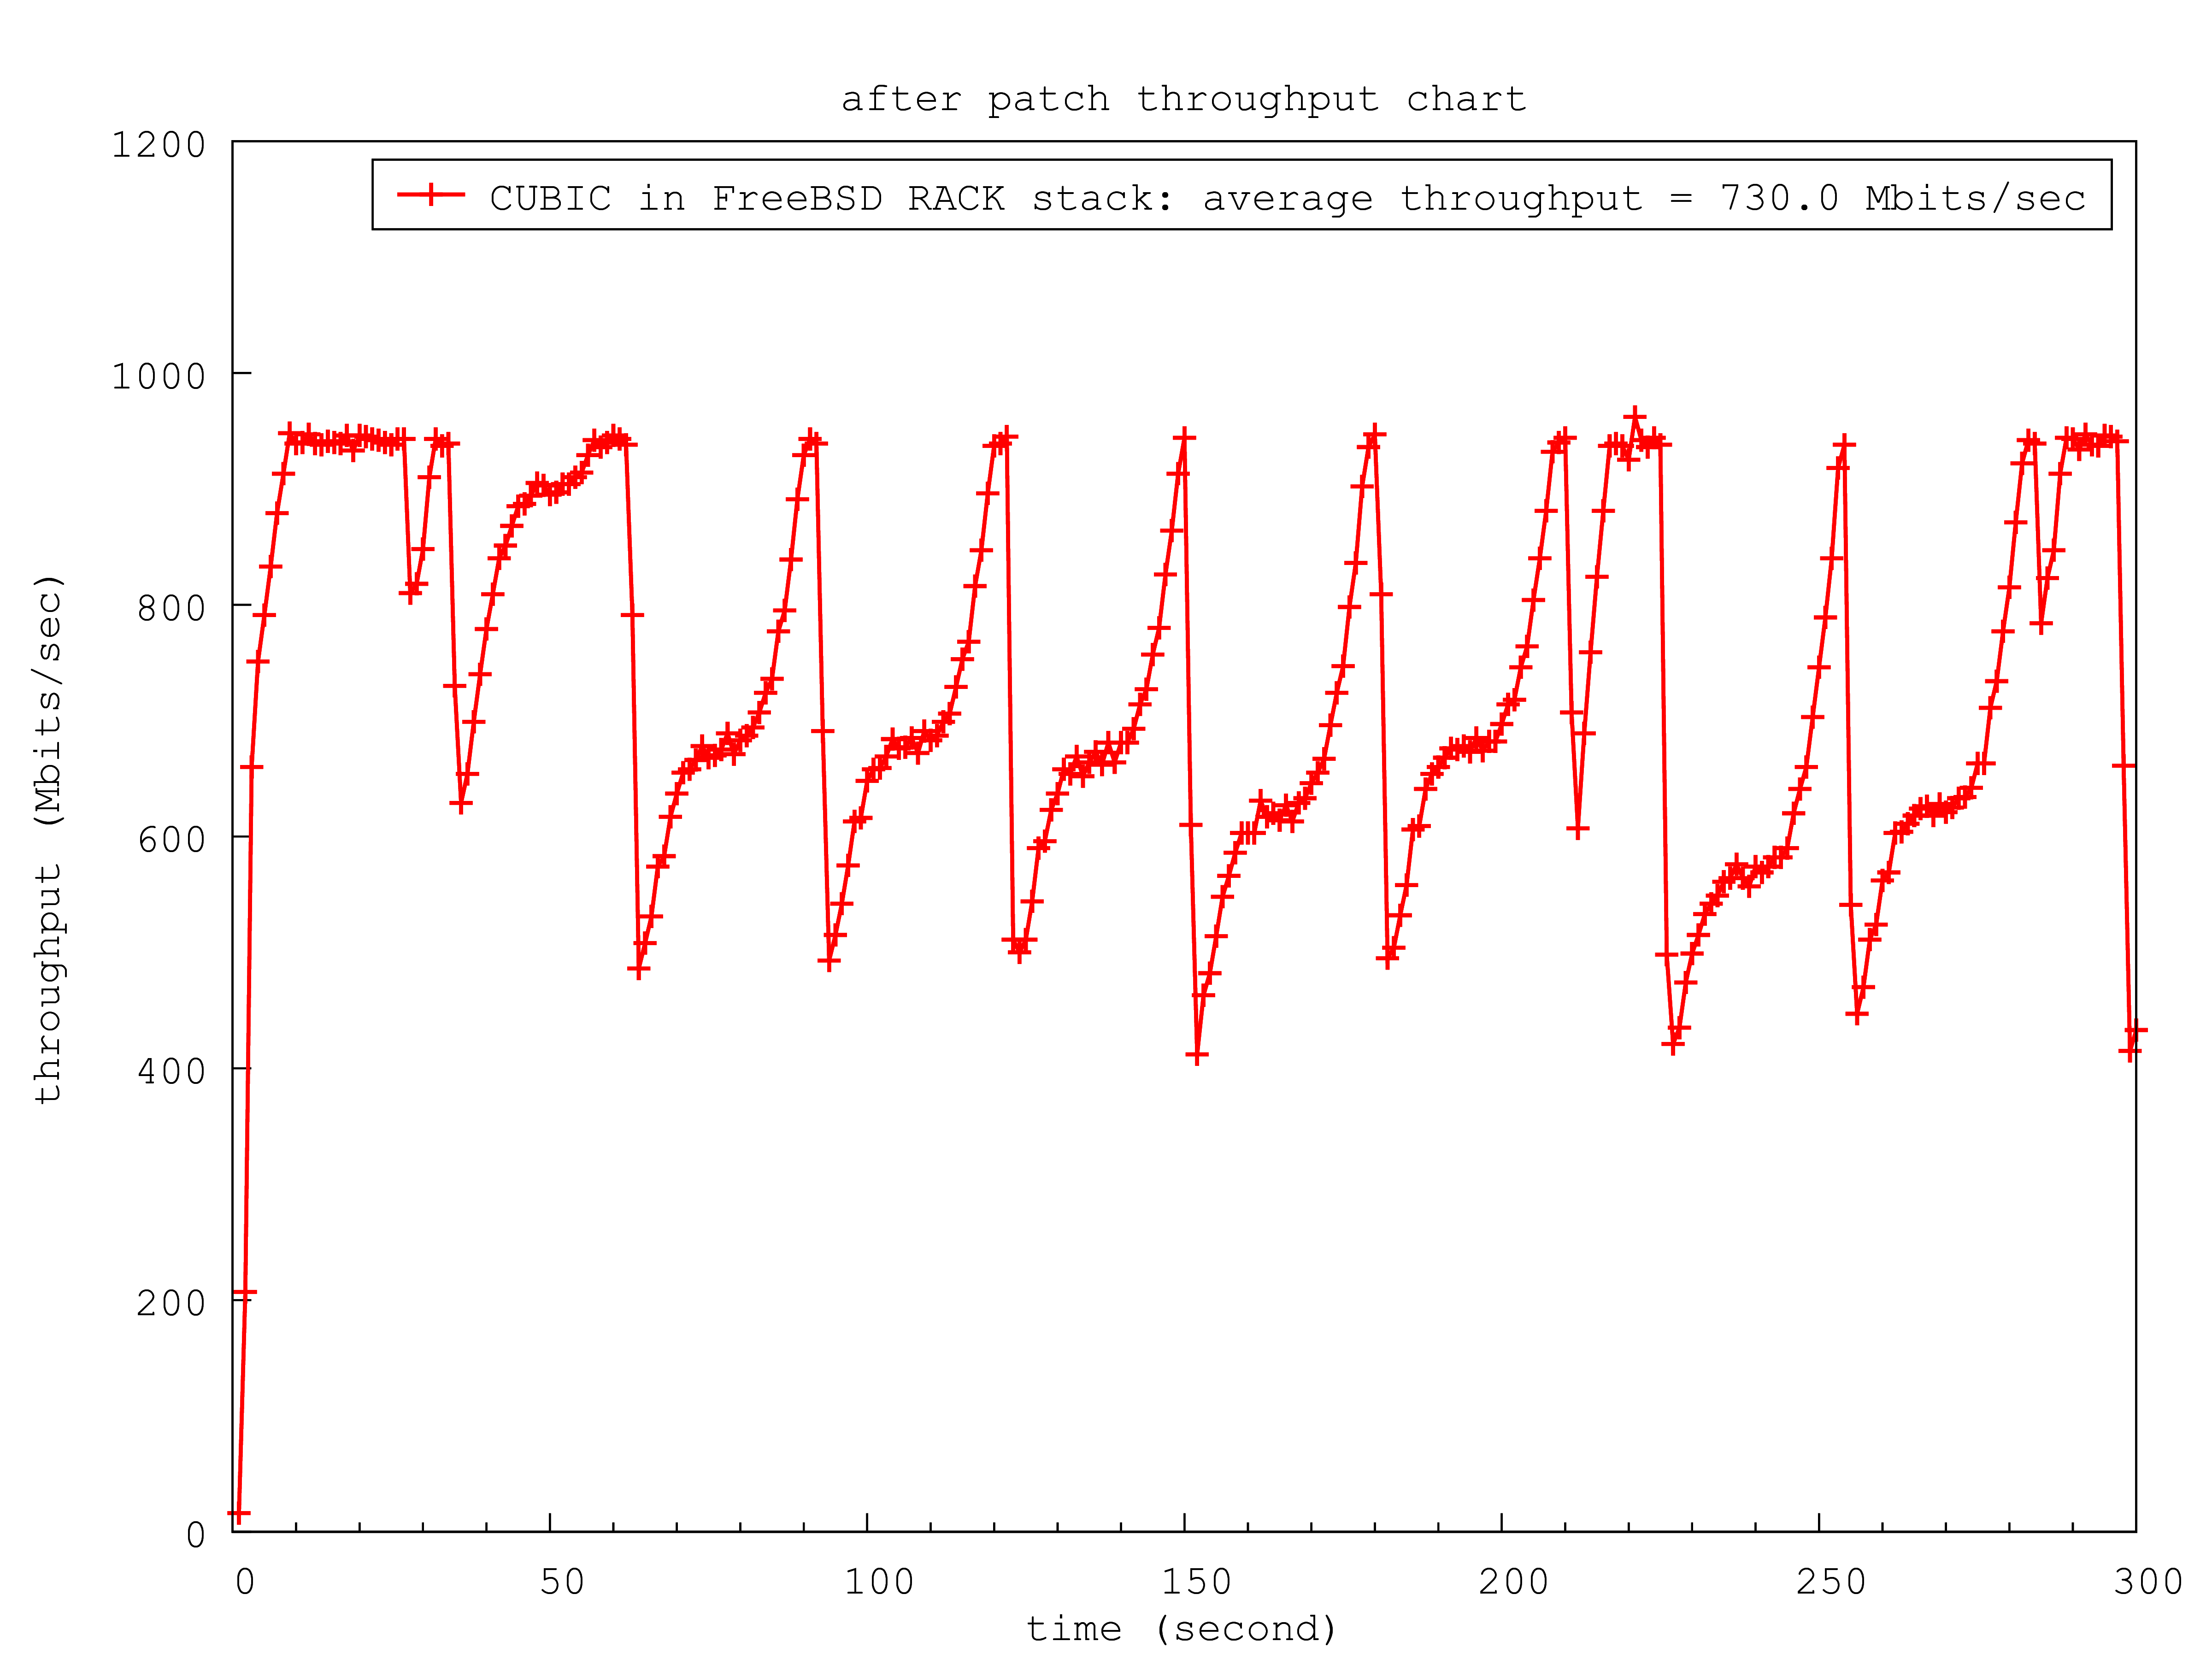
CUBIC growth pattern before/after patch in FreeBSD RACK stack: 
For reference, the CUBIC in Linux kernel growth pattern is also attached: 
single flow 300 seconds performance with 1Gbps x 40ms BDP
TCP CC |
version |
iperf3 single flow 300s average throughput |
comment |
CUBIC in freebsd default stack |
before patch |
715 Mbits/sec |
base |
after patch |
693 Mbits/sec |
a benign -3.1% performance lose (maybe caused by the RTO between 60s and 70s), but cwnd growth has finer gratitude and less delta (grows smoother) |
|
CUBIC in freebsd RACK stack |
before patch |
738 Mbits/sec |
base |
after patch |
730 Mbits/sec |
negligible -1.1% performance lose |
|
CUBIC in Linux |
kernel 6.8.0 |
725 Mbits/sec |
reference |
CUBIC cwnd and throughput before patch in FreeBSD default stack:
CUBIC cwnd and throughput after patch in FreeBSD default stack:
CUBIC cwnd and throughput before patch in FreeBSD RACK stack:
CUBIC cwnd and throughput after patch in FreeBSD RACK stack:
CUBIC cwnd and throughput in Linux stack:
loss resilience in LAN test (no additional latency added)
Similar to testD46046, this configure tests TCP CUBIC in the VM traffic sender, with 1%, 2%, 3% or 4% incoming packet drop rate at the Linux receiver. No additional latency is added.
root@n1fbsd:~ # ping -c 4 -S n1fbsd Linux
PING Linux (192.168.50.46) from n1fbsdvm: 56 data bytes
64 bytes from 192.168.50.46: icmp_seq=0 ttl=64 time=0.499 ms
64 bytes from 192.168.50.46: icmp_seq=1 ttl=64 time=0.797 ms
64 bytes from 192.168.50.46: icmp_seq=2 ttl=64 time=0.860 ms
64 bytes from 192.168.50.46: icmp_seq=3 ttl=64 time=0.871 ms

--- Linux ping statistics ---
4 packets transmitted, 4 packets received, 0.0% packet loss
round-trip min/avg/max/stddev = 0.499/0.757/0.871/0.151 ms
root@n1fbsd:~ #

root@n1ubuntu24:~ # ping -c 4 -I 192.168.50.161 Linux
PING Linux (192.168.50.46) from 192.168.50.161 : 56(84) bytes of data.
64 bytes from Linux (192.168.50.46): icmp_seq=1 ttl=64 time=0.528 ms
64 bytes from Linux (192.168.50.46): icmp_seq=2 ttl=64 time=0.583 ms
64 bytes from Linux (192.168.50.46): icmp_seq=3 ttl=64 time=0.750 ms
64 bytes from Linux (192.168.50.46): icmp_seq=4 ttl=64 time=0.590 ms

--- Linux ping statistics ---
4 packets transmitted, 4 received, 0% packet loss, time 3165ms
rtt min/avg/max/mdev = 0.528/0.612/0.750/0.082 ms
root@n1ubuntu24:~ #

## list of different packet loss rate
cc@Linux:~ % sudo iptables -A INPUT -p tcp --dport 5201 -m statistic --mode nth --every 100 --packet 0 -j DROP
cc@Linux:~ % sudo iptables -A INPUT -p tcp --dport 5201 -m statistic --mode nth --every 50 --packet 0 -j DROP
cc@Linux:~ % sudo iptables -A INPUT -p tcp --dport 5201 -m statistic --mode nth --every 33 --packet 0 -j DROP
cc@Linux:~ % sudo iptables -A INPUT -p tcp --dport 5201 -m statistic --mode nth --every 25 --packet 0 -j DROP
...
- iperf3 command
cc@Linux:~ % iperf3 -s -p 5201 --affinity 1
root@n1fbsd:~ # iperf3 -B n1fbsd --cport 54321 -c Linux -p 5201 -l 1M -t 30 -i 1 -f m -VC cubic
- iperf3 single flow 30s average throughput under different packet loss rate at the Linux receiver
TCP CC |
version |
1% loss rate |
2% loss rate |
3% loss rate |
4% loss rate |
comment |
CUBIC in freebsd default stack |
before patch |
854 Mbits/sec |
331 Mbits/sec |
53.1 Mbits/sec |
22.9 Mbits/sec |
|
after patch |
814 Mbits/sec |
150 Mbits/sec |
45.1 Mbits/sec |
24.2 Mbits/sec |
|
|
NewReno in freebsd default stack |
15-CURRENT |
814 Mbits/sec |
110 Mbits/sec |
40.4 Mbits/sec |
21.5 Mbits/sec |
|
|
||||||
CUBIC in freebsd RACK stack |
before patch |
552 Mbits/sec |
353 Mbits/sec |
185 Mbits/sec |
130 Mbits/sec |
|
after patch |
515 Mbits/sec |
337 Mbits/sec |
181 Mbits/sec |
127 Mbits/sec |
|
|
NewReno in freebsd RACK stack |
15-CURRENT |
462 Mbits/sec |
281 Mbits/sec |
163 Mbits/sec |
118 Mbits/sec |
|
|
||||||
CUBIC in Linux |
kernel 6.8.0 |
665 Mbits/sec |
645 Mbits/sec |
550 Mbits/sec |
554 Mbits/sec |
reference |
NewReno in Linux |
kernel 6.8.0 |
924 Mbits/sec |
862 Mbits/sec |
740 Mbits/sec |
599 Mbits/sec |
reference |
tri-point topology testbed
Now there are two virtual machines (VMs) as traffic senders at the same time. They are hosted by Bhyve in two separate physical boxs (Beelink SER5 AMD Mini PCs). The traffic receiver is the same Linux box as before, for the simplicity of a tri-point topology.
The three physical boxes are connected through a 5 Port Gigabit Ethernet Switch (TP-Link TL-SG105). The switch has a shared 1Mb (0.125MB) Packet Buffer Memory, which is just 2.5% of the 5 Mbytes BDP (1000Mbps x 40ms).
- additional 40ms latency is added/emulated in the receiver and senders/receiver have 2.5MB buffer (50% BDP)
- iperf3 commands
iperf3 -s -p 5201
iperf3 -B ${src} --cport ${tcp_port} -c ${dst} -p 5201 -l 1M -t 200 -i 1 -f m -VC ${name}
iperf3 -s -p 5202
iperf3 -B ${src} --cport ${tcp_port} -c ${dst} -p 5202 -l 1M -t 200 -i 1 -f m -VC ${name}
FreeBSD VM sender1 & sender2 info |
FreeBSD 15.0-CURRENT (GENERIC) #0 main-6f6c07813b38: Fri Mar 21 2025 |
Linux VM sender1 & sender2 info |
Ubuntu server 24.04.2 LTS (GNU/Linux 6.8.0-55-generic x86_64) |
Linux receiver info |
Ubuntu desktop 24.04.2 LTS (GNU/Linux 6.11.0-19-generic x86_64) |
link utilization under two competing TCP flows
- the link utilization of two competing TCP flows starting at the same time from each VM
TCP CC |
version |
flow1 average throughput |
flow2 average throughput |
link utilization: average(flow1 + flow2) |
TCP fairness |
comment |
CUBIC in freebsd default stack |
before patch |
31.1 Mbits/sec |
31.5 Mbits/sec |
62.6 Mbits/sec |
100% |
|
after patch |
23.5 Mbits/sec |
21.0 Mbits/sec |
44.5 Mbits/sec |
99.7% |
|
|
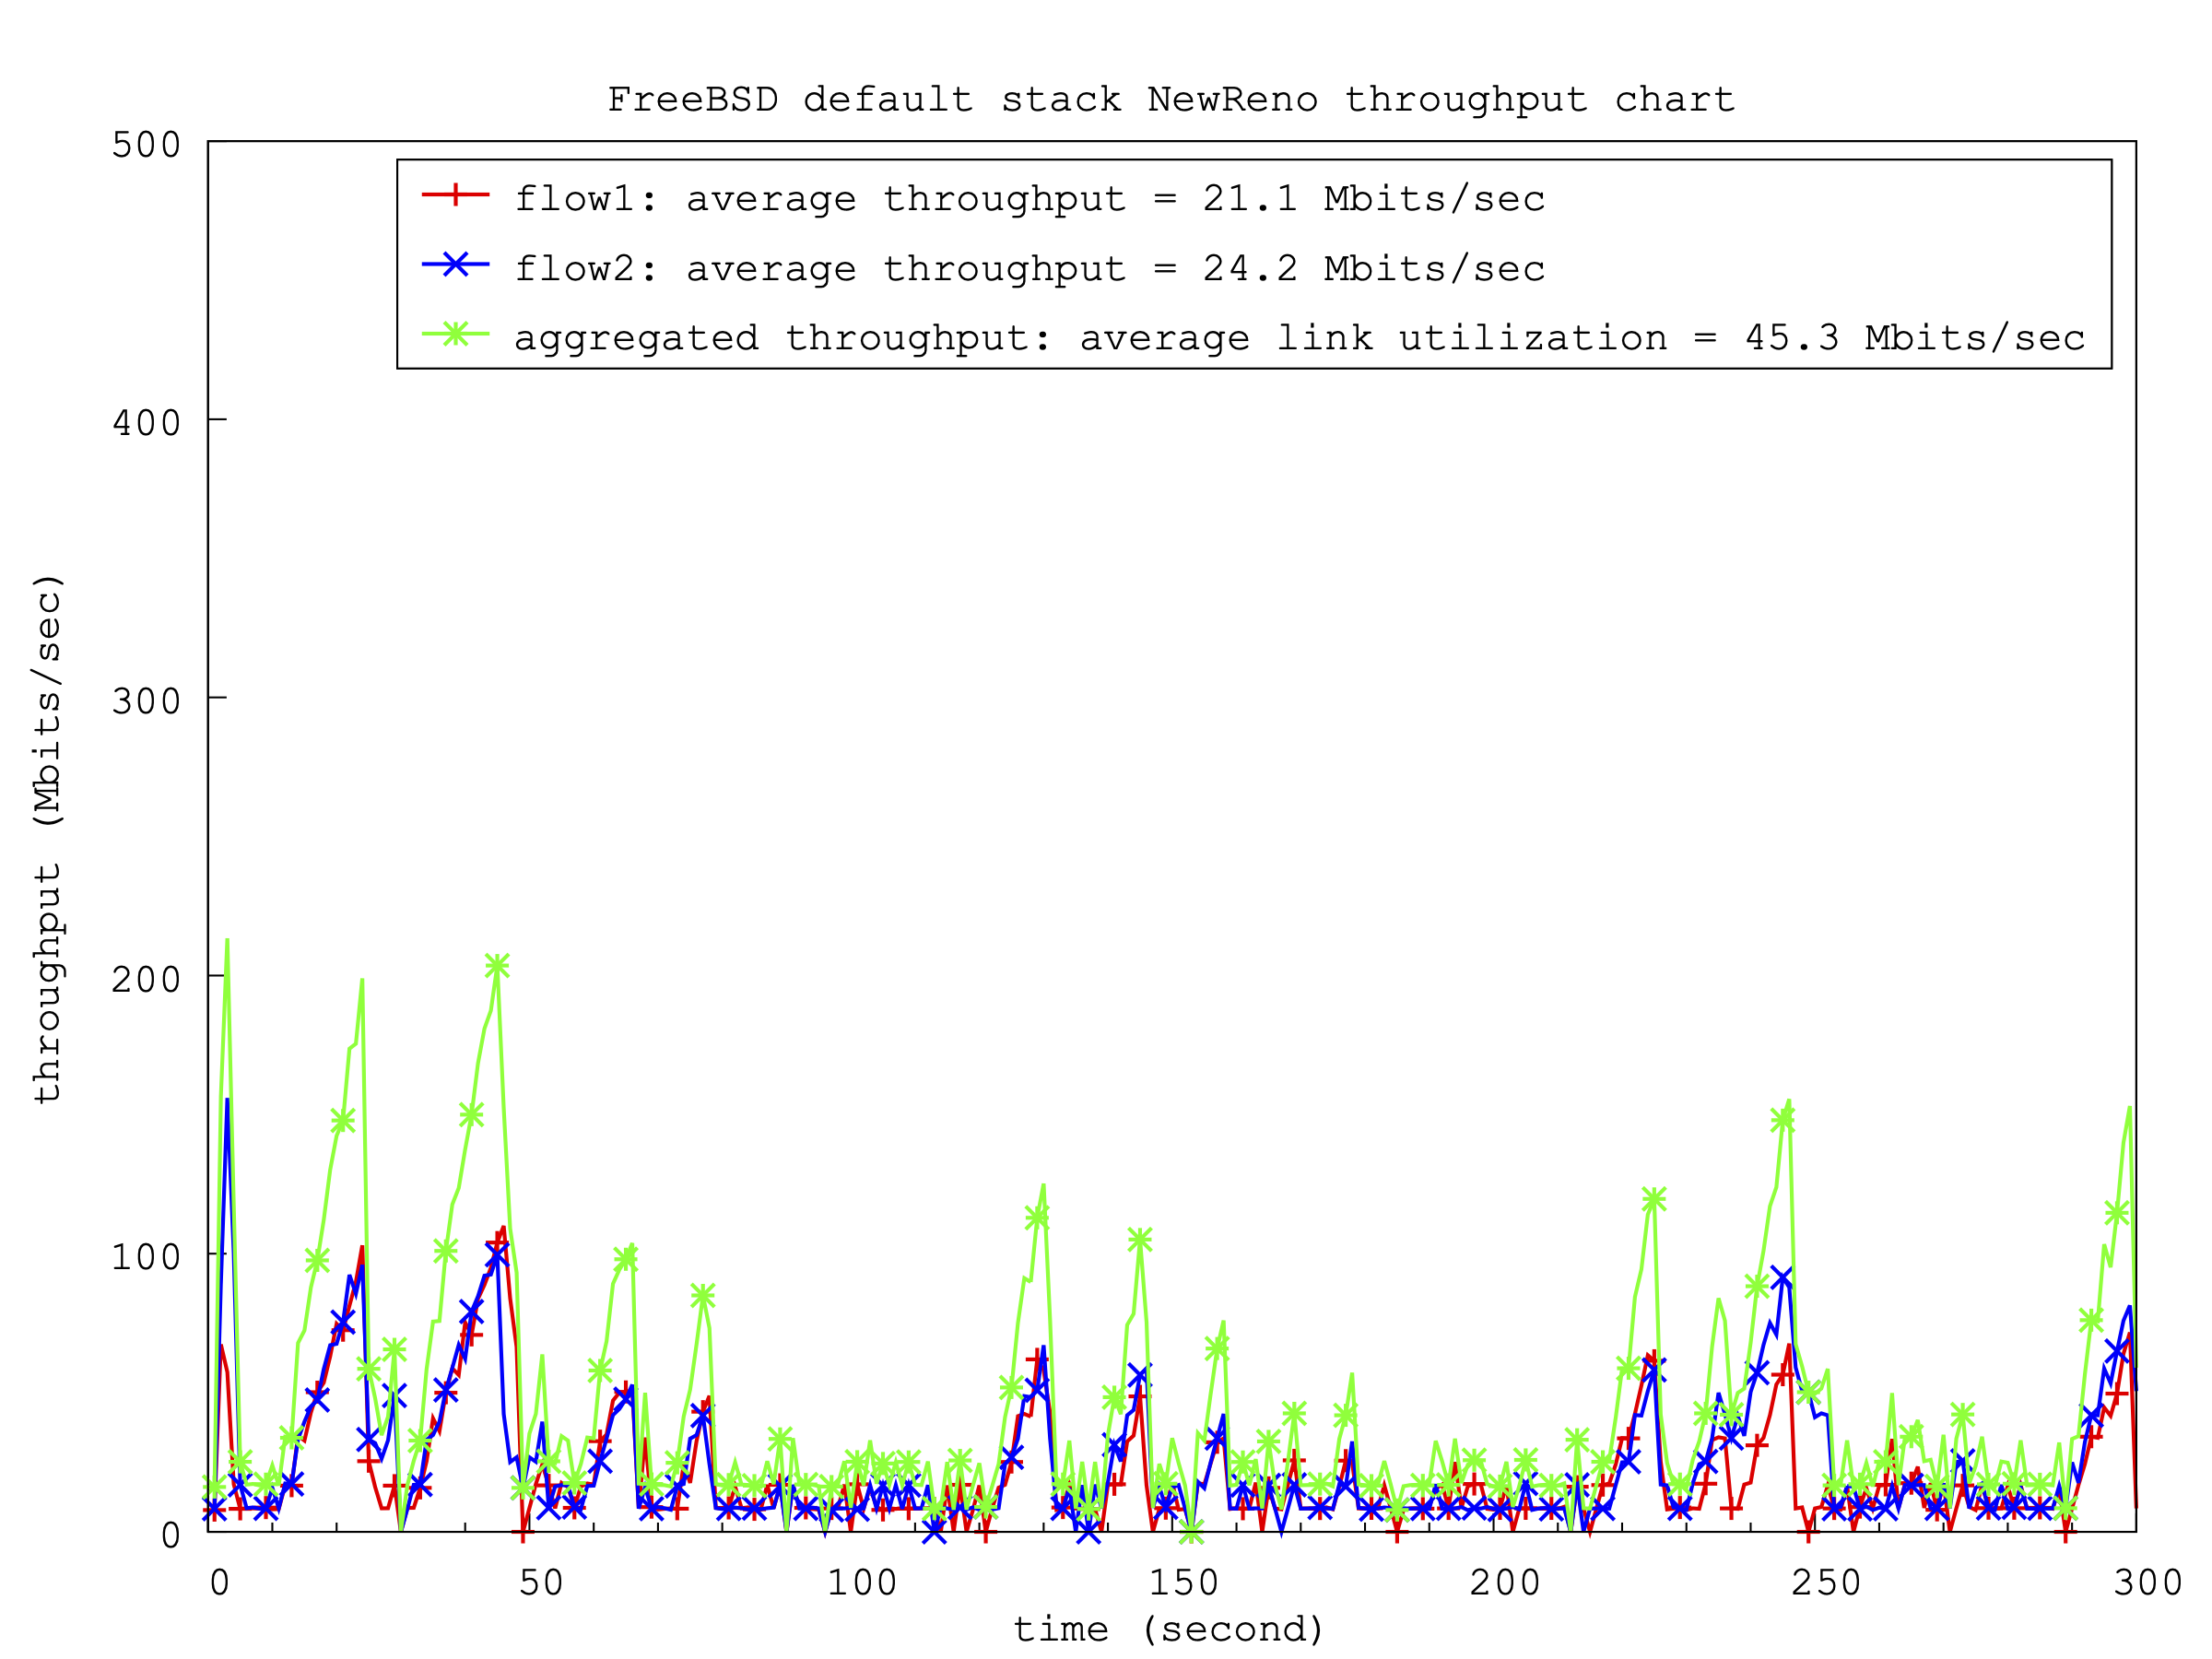
NewReno in freebsd default stack |
15-CURRENT |
21.1 Mbits/sec |
24.2 Mbits/sec |
45.3 Mbits/sec |
99.5% |
|
|
||||||
CUBIC in freebsd RACK stack |
before patch |
21.8 Mbits/sec |
21.4 Mbits/sec |
43.2 Mbits/sec |
100% |
|
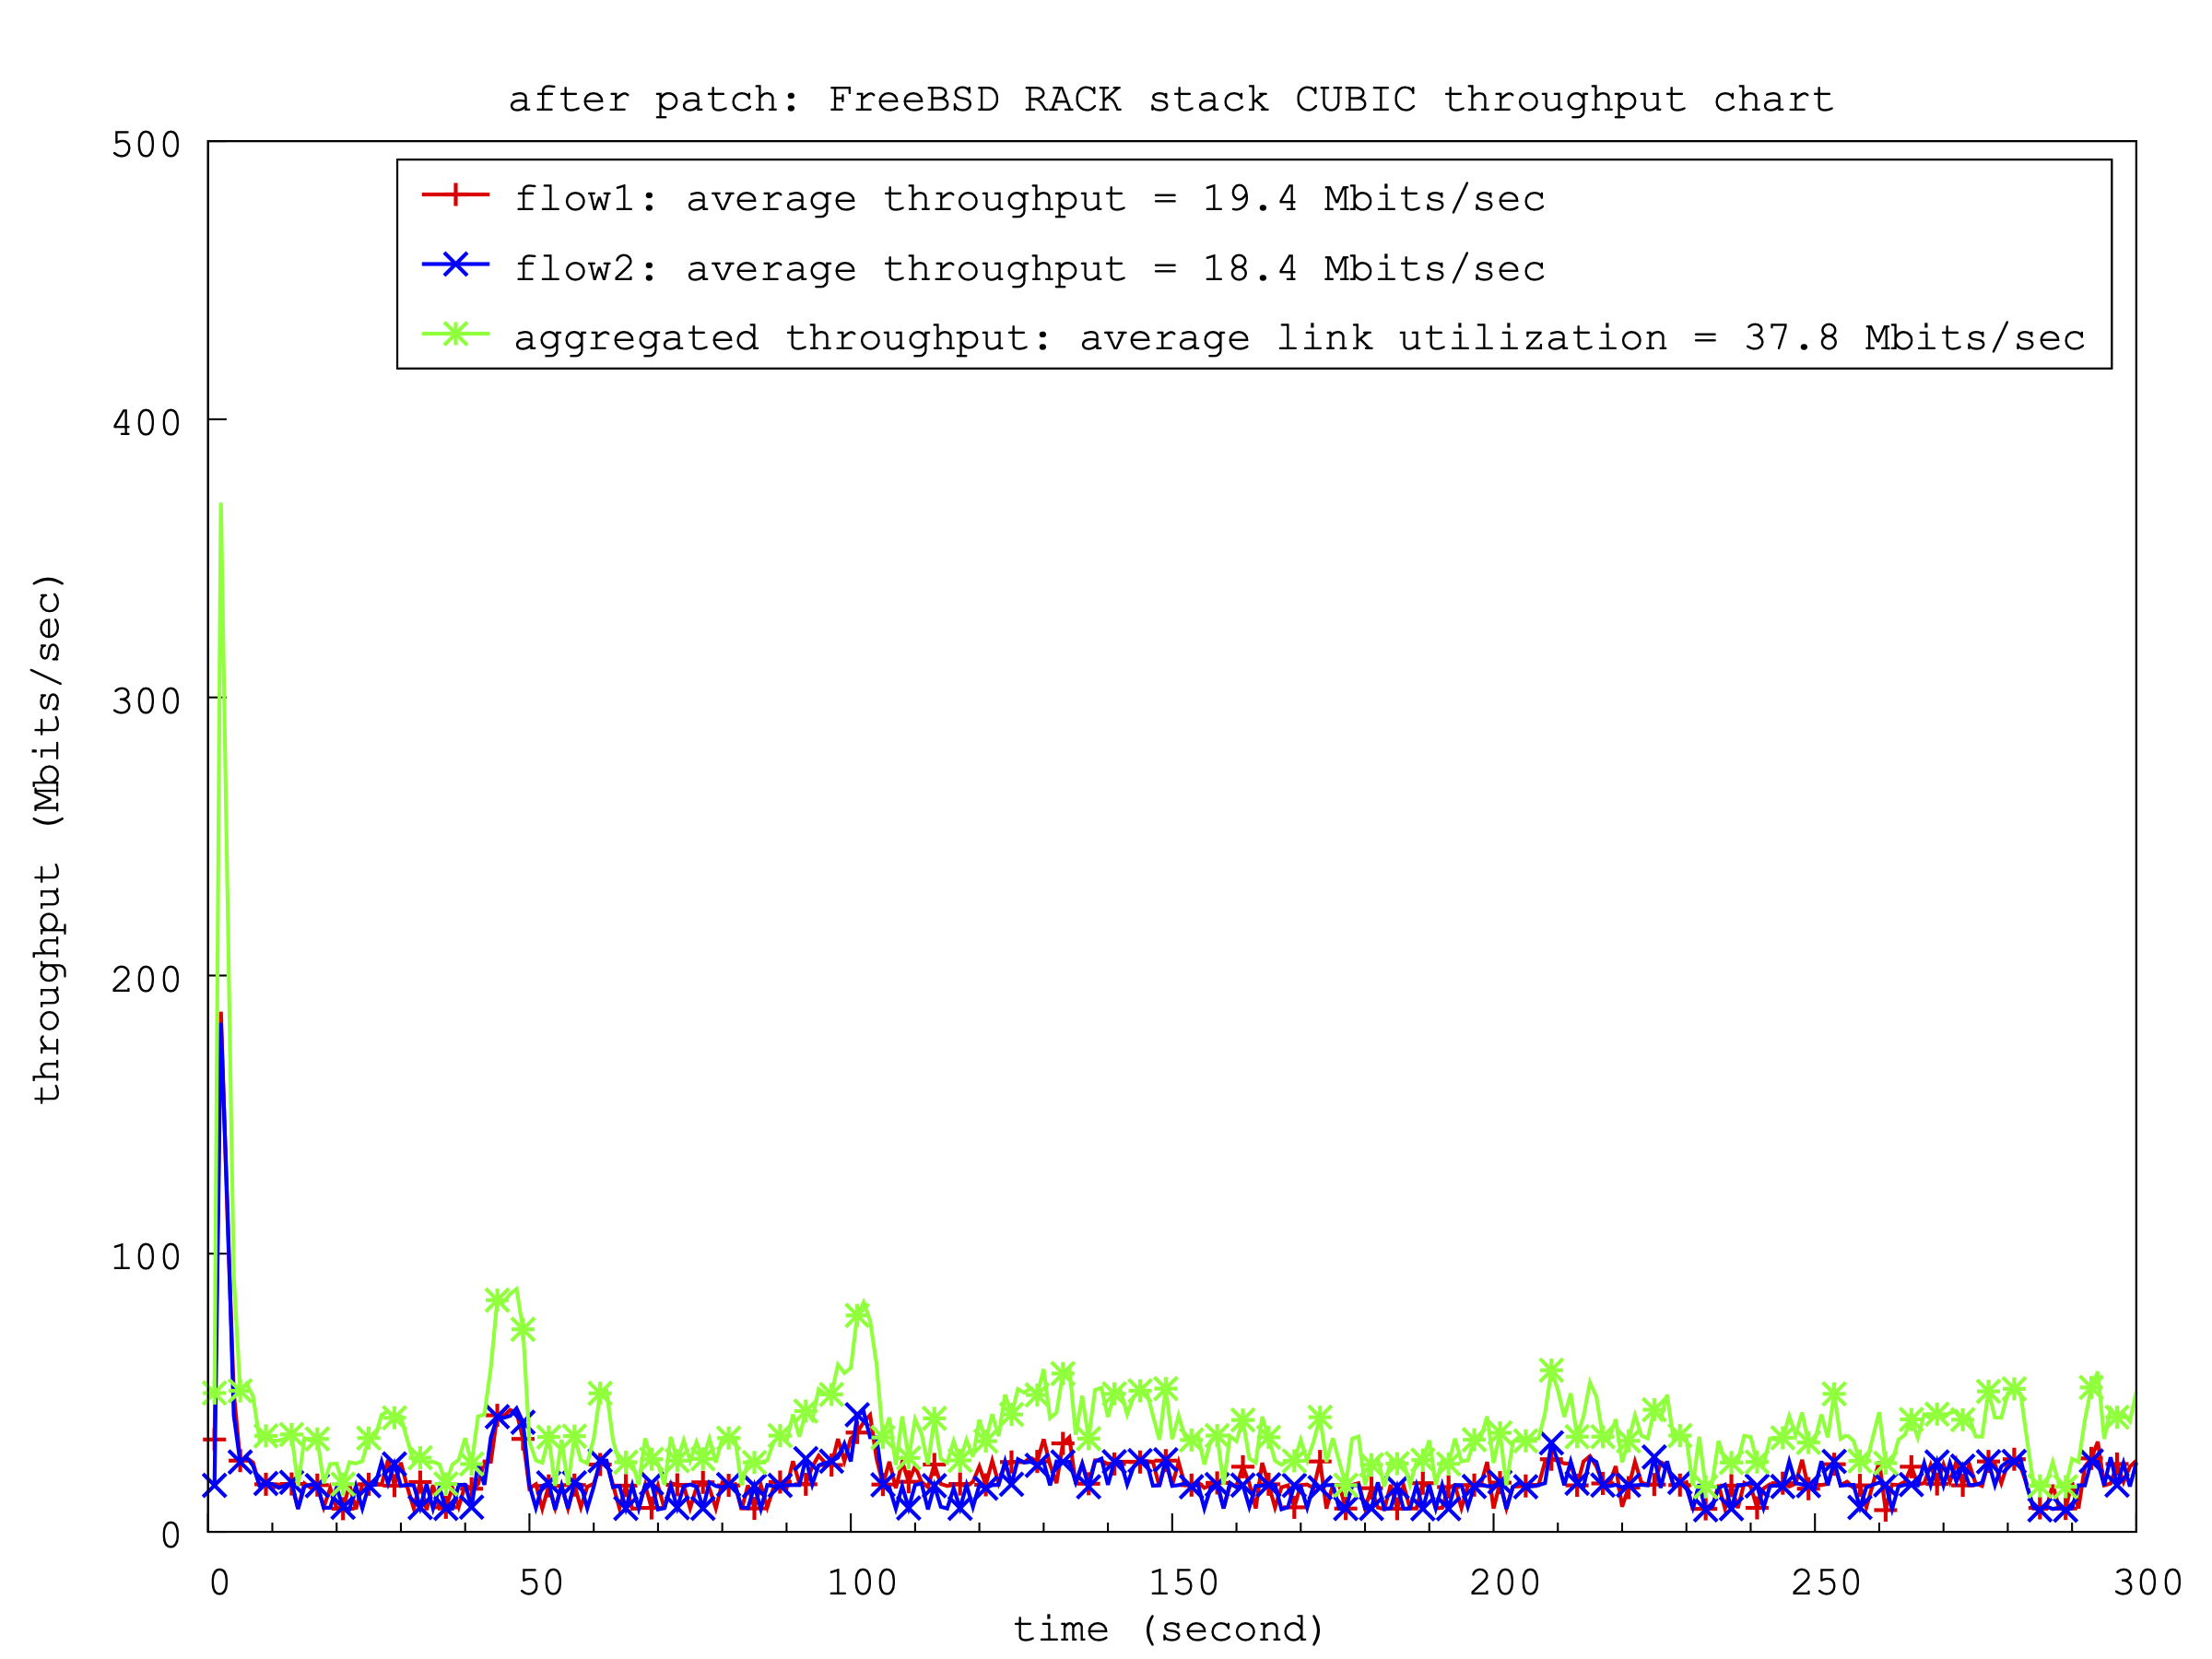
after patch |
19.4 Mbits/sec |
18.4 Mbits/sec |
37.8 Mbits/sec |
99.9% |
|
|
NewReno in freebsd RACK stack |
15-CURRENT |
16.0 Mbits/sec |
15.8 Mbits/sec |
31.8 Mbits/sec |
100% |
|
|
||||||
CUBIC in Linux |
kernel 6.8.0 |
19.2 Mbits/sec |
19.2 Mbits/sec |
38.4 Mbits/sec |
100% |
reference |
NewReno in Linux |
kernel 6.8.0 |
20.4 Mbits/sec |
20.5 Mbits/sec |
40.9 Mbits/sec |
100% |
reference |
CUBIC cwnd and throughput before patch in FreeBSD default stack:
CUBIC cwnd and throughput after patch in FreeBSD default stack:
NewReno cwnd and throughput in FreeBSD default stack:
CUBIC cwnd and throughput before patch in FreeBSD RACK stack:
CUBIC cwnd and throughput after patch in FreeBSD RACK stack:
NewReno cwnd and throughput in FreeBSD RACK stack:
CUBIC cwnd and throughput in Linux:
NewReno cwnd and throughput in Linux:
VM environment with a 1GE router
tri-point topology testbed
The three physical boxes are connected through a 5-Port Gigabit Router (EdgeRouter X).
Turns out the internal virtual interface itf0 used by EdgeOS for inter-process communication is dropping packets before the qdisc (queueing discipline) level takes effects. So we could not see any TCP vs. AQM policy effects on the bottleneck. Even with MAX MTU=2018, the qdisc still could not take effects. I also found that the five Gigabit Ethernet ports are connected through a single internal switch chip, which may introduce limitations in certain configurations. In my test with MAX MTU=2018 and subnet configurate in wiki page Configure a 1Gbps EdgeRouter-X, iperf3 reports the max TCP performance through its IPv4 forwarding rate at 404 Mbits/sec. Therefore, we can only see the TCP performance under this unknown inter-fabric buffer, instead of AQM.
- for example:
ubnt@EdgeRouter-X-5-Port:~$ ip -s link show itf0
2: itf0: <BROADCAST,MULTICAST,UP,LOWER_UP> mtu 2018 qdisc pfifo_fast state UNKNOWN mode DEFAULT group default qlen 1000
    link/ether 80:2a:a8:5e:13:f7 brd ff:ff:ff:ff:ff:ff
    RX: bytes  packets  errors  dropped overrun mcast
    18897611234 18722289 0       24580   0       0                              <<< RX dropped = packets dropped before reaching the qdisc
    TX: bytes  packets  errors  dropped carrier collsns
    18974731668 18571885 0       0       0       0
ubnt@EdgeRouter-X-5-Port:~$ sudo tc -s qdisc show dev itf0
qdisc pfifo_fast 0: root refcnt 2 bands 3 priomap  1 2 2 2 1 2 0 0 1 1 1 1 1 1 1 1
 Sent 18826039239 bytes 18571902 pkt (dropped 0, overlimits 0 requeues 530)     <<< if it is dropped here, it means packets dropped by the queue itself, usually because it’s full
 backlog 0b 0p requeues 530
ubnt@EdgeRouter-X-5-Port:~$
ubnt@EdgeRouter-X-5-Port# ip -s link show eth1
5: eth1@itf0: <BROADCAST,MULTICAST,UP,LOWER_UP> mtu 2018 qdisc pfifo state UP mode DEFAULT group default qlen 1000
    link/ether 80:2a:a8:5e:13:f3 brd ff:ff:ff:ff:ff:ff
    alias Local
    RX: bytes  packets  errors  dropped overrun mcast
    13075123883 9714165  0       0       0       70
    TX: bytes  packets  errors  dropped carrier collsns
    3966141427 6636939  0       0       0       0
[edit]
ubnt@EdgeRouter-X-5-Port# ip -s link show eth2
6: eth2@itf0: <BROADCAST,MULTICAST,UP,LOWER_UP> mtu 2018 qdisc pfifo state UP mode DEFAULT group default qlen 1000
    link/ether 80:2a:a8:5e:13:f4 brd ff:ff:ff:ff:ff:ff
    alias Local
    RX: bytes  packets  errors  dropped overrun mcast
    6654162760 8064107  0       0       0       139
    TX: bytes  packets  errors  dropped carrier collsns
    12910616151 10469529 0       0       0       0
[edit]
ubnt@EdgeRouter-X-5-Port# ip -s link show eth3
7: eth3@itf0: <BROADCAST,MULTICAST,UP,LOWER_UP> mtu 2018 qdisc pfifo state UP mode DEFAULT group default qlen 1000
    link/ether 80:2a:a8:5e:13:f5 brd ff:ff:ff:ff:ff:ff
    alias Local
    RX: bytes  packets  errors  dropped overrun mcast
    7385125291 8078869  0       0       0       160
    TX: bytes  packets  errors  dropped carrier collsns
    10652730803 8729464  0       0       0       0
[edit]
ubnt@EdgeRouter-X-5-Port#
ubnt@EdgeRouter-X-5-Port# sudo tc -s qdisc show dev eth1
qdisc pfifo 8007: root refcnt 2 limit 3500p
 Sent 3906923804 bytes 5905040 pkt (dropped 0, overlimits 0 requeues 0)
 backlog 0b 0p requeues 0
[edit]
ubnt@EdgeRouter-X-5-Port# sudo tc -s qdisc show dev eth2
qdisc pfifo 8008: root refcnt 2 limit 3500p
 Sent 12887938442 bytes 10128384 pkt (dropped 0, overlimits 0 requeues 0)
 backlog 0b 0p requeues 0
[edit]
ubnt@EdgeRouter-X-5-Port# sudo tc -s qdisc show dev eth3
qdisc pfifo 8009: root refcnt 2 limit 3500p
 Sent 7430101832 bytes 6590019 pkt (dropped 0, overlimits 0 requeues 0)
 backlog 0b 0p requeues 0
[edit]- additional 40ms latency is added/emulated in the receiver and senders/receiver have 5MB buffer (100% BDP)
root@n1fbsd:~ # ping -c 4 Linux
PING Linux (192.168.3.10): 56 data bytes
64 bytes from 192.168.3.10: icmp_seq=0 ttl=63 time=41.228 ms
64 bytes from 192.168.3.10: icmp_seq=1 ttl=63 time=41.275 ms
64 bytes from 192.168.3.10: icmp_seq=2 ttl=63 time=41.190 ms
64 bytes from 192.168.3.10: icmp_seq=3 ttl=63 time=41.436 ms

--- Linux ping statistics ---
4 packets transmitted, 4 packets received, 0.0% packet loss
round-trip min/avg/max/stddev = 41.190/41.282/41.436/0.094 ms
root@n1fbsd:~ #

root@n2fbsd:~ # ping -c 4 Linux
PING Linux (192.168.3.10): 56 data bytes
64 bytes from 192.168.3.10: icmp_seq=0 ttl=63 time=41.165 ms
64 bytes from 192.168.3.10: icmp_seq=1 ttl=63 time=41.304 ms
64 bytes from 192.168.3.10: icmp_seq=2 ttl=63 time=40.898 ms
64 bytes from 192.168.3.10: icmp_seq=3 ttl=63 time=41.280 ms

--- Linux ping statistics ---
4 packets transmitted, 4 packets received, 0.0% packet loss
round-trip min/avg/max/stddev = 40.898/41.162/41.304/0.161 ms
root@n2fbsd:~ #

root@n1fbsd:~ # sysctl -f /etc/sysctl.conf
net.inet.tcp.hostcache.enable: 0 -> 0
kern.ipc.maxsockbuf: 10485760 -> 10485760
net.inet.tcp.sendbuf_max: 5242880 -> 5242880
net.inet.tcp.recvbuf_max: 5242880 -> 5242880
root@n1fbsd:~ #

root@n2fbsd:~ # sysctl -f /etc/sysctl.conf
net.inet.tcp.hostcache.enable: 0 -> 0
kern.ipc.maxsockbuf: 10485760 -> 10485760
net.inet.tcp.sendbuf_max: 5242880 -> 5242880
net.inet.tcp.recvbuf_max: 5242880 -> 5242880
root@n2fbsd:~ #

cc@Linux:~ % sudo sysctl -p
net.ipv4.tcp_no_metrics_save = 1
net.core.rmem_max = 10485760
net.core.wmem_max = 10485760
net.ipv4.tcp_rmem = 4096 131072 5242880
net.ipv4.tcp_wmem = 4096  16384 5242880
cc@Linux:~ %
- iperf3 commands
iperf3 -s -p 5201
iperf3 -B ${src} --cport ${tcp_port} -c ${dst} -p 5201 -l 1M -t 300 -i 1 -f m -VC ${name}
iperf3 -s -p 5202
iperf3 -B ${src} --cport ${tcp_port} -c ${dst} -p 5202 -l 1M -t 300 -i 1 -f m -VC ${name}
FreeBSD VM sender1 & sender2 info |
FreeBSD 15.0-CURRENT (GENERIC) #0 main-6f6c07813b38: Fri Mar 21 2025 |
Linux VM sender1 & sender2 info |
Ubuntu server 24.04.2 LTS (GNU/Linux 6.8.0-58-generic x86_64) |
Linux receiver info |
Ubuntu desktop 24.04.2 LTS (GNU/Linux 6.11.0-19-generic x86_64) |
- the link utilization of two competing TCP flows starting at the same time from each VM
TCP CC |
version |
flow1 average throughput |
flow2 average throughput |
link utilization: average(flow1 + flow2) |
TCP fairness |
additional stats |
comment |
CUBIC in freebsd default stack |
before patch |
80.1 Mbits/sec |
61.5 Mbits/sec |
141.6 Mbits/sec |
98.3% |
flow1: avg_srtt: 99002, max_srtt: 180000 µs |
|
after patch |
66.8 Mbits/sec |
74.2 Mbits/sec |
141.0 Mbits/sec |
99.7% |
flow1: avg_srtt: 125410, max_srtt: 170625 µs |
|
|
NewReno in freebsd default stack |
15-CURRENT |
76.5 Mbits/sec |
65.5 Mbits/sec |
142.0 Mbits/sec |
99.4% |
flow1: avg_srtt: 97936, max_srtt: 173437 µs |
|
|
|||||||
CUBIC in freebsd RACK stack |
before patch |
68.1 Mbits/sec |
75.4 Mbits/sec |
143.5 Mbits/sec |
99.7% |
flow1: avg_srtt: 116167, max_srtt: 190875 µs |
|
after patch |
75.4 Mbits/sec |
67.7 Mbits/sec |
143.1 Mbits/sec |
99.7% |
flow1: avg_srtt: 107442, max_srtt: 194170 µs |
|
|
NewReno in freebsd RACK stack |
15-CURRENT |
68.8 Mbits/sec |
73.9 Mbits/sec |
142.7 Mbits/sec |
99.9% |
flow1: avg_srtt: 100263, max_srtt: 170952 µs |
Above flows' srtt: 98ms ~ 125ms. |
|
|||||||
CUBIC in Linux |
kernel 6.8.0 |
108 Mbits/sec |
125 Mbits/sec |
233 Mbits/sec |
99.5% |
flow1: avg_srtt: 73931.1, max_srtt: 126305 µs |
As reference, I believe Linux's TCP small queue plays a critical role in reducing queueing delay. |
NewReno in Linux |
kernel 6.8.0 |
86.8 Mbits/sec |
149.0 Mbits/sec |
235.8 Mbits/sec |
93.5% |
flow1: avg_srtt: 76593.3, max_srtt: 142904 µs |
average queueing delay: 60ms ~ 75ms |
CUBIC cwnd and throughput before patch in FreeBSD default stack:
CUBIC cwnd and throughput after patch in FreeBSD default stack:
NewReno cwnd and throughput in FreeBSD default stack:
CUBIC cwnd and throughput before patch in FreeBSD RACK stack:
CUBIC cwnd and throughput after patch in FreeBSD RACK stack:
NewReno cwnd and throughput in FreeBSD RACK stack:
CUBIC cwnd and throughput in Linux:
NewReno cwnd and throughput in Linux:
Emulab bare metal testbed with a 1GE Linux router
Testbed in a dumbbell topology (pc3000 nodes with 1Gbps links) used here are from Emulab.net: Emulab hardware
testbed design
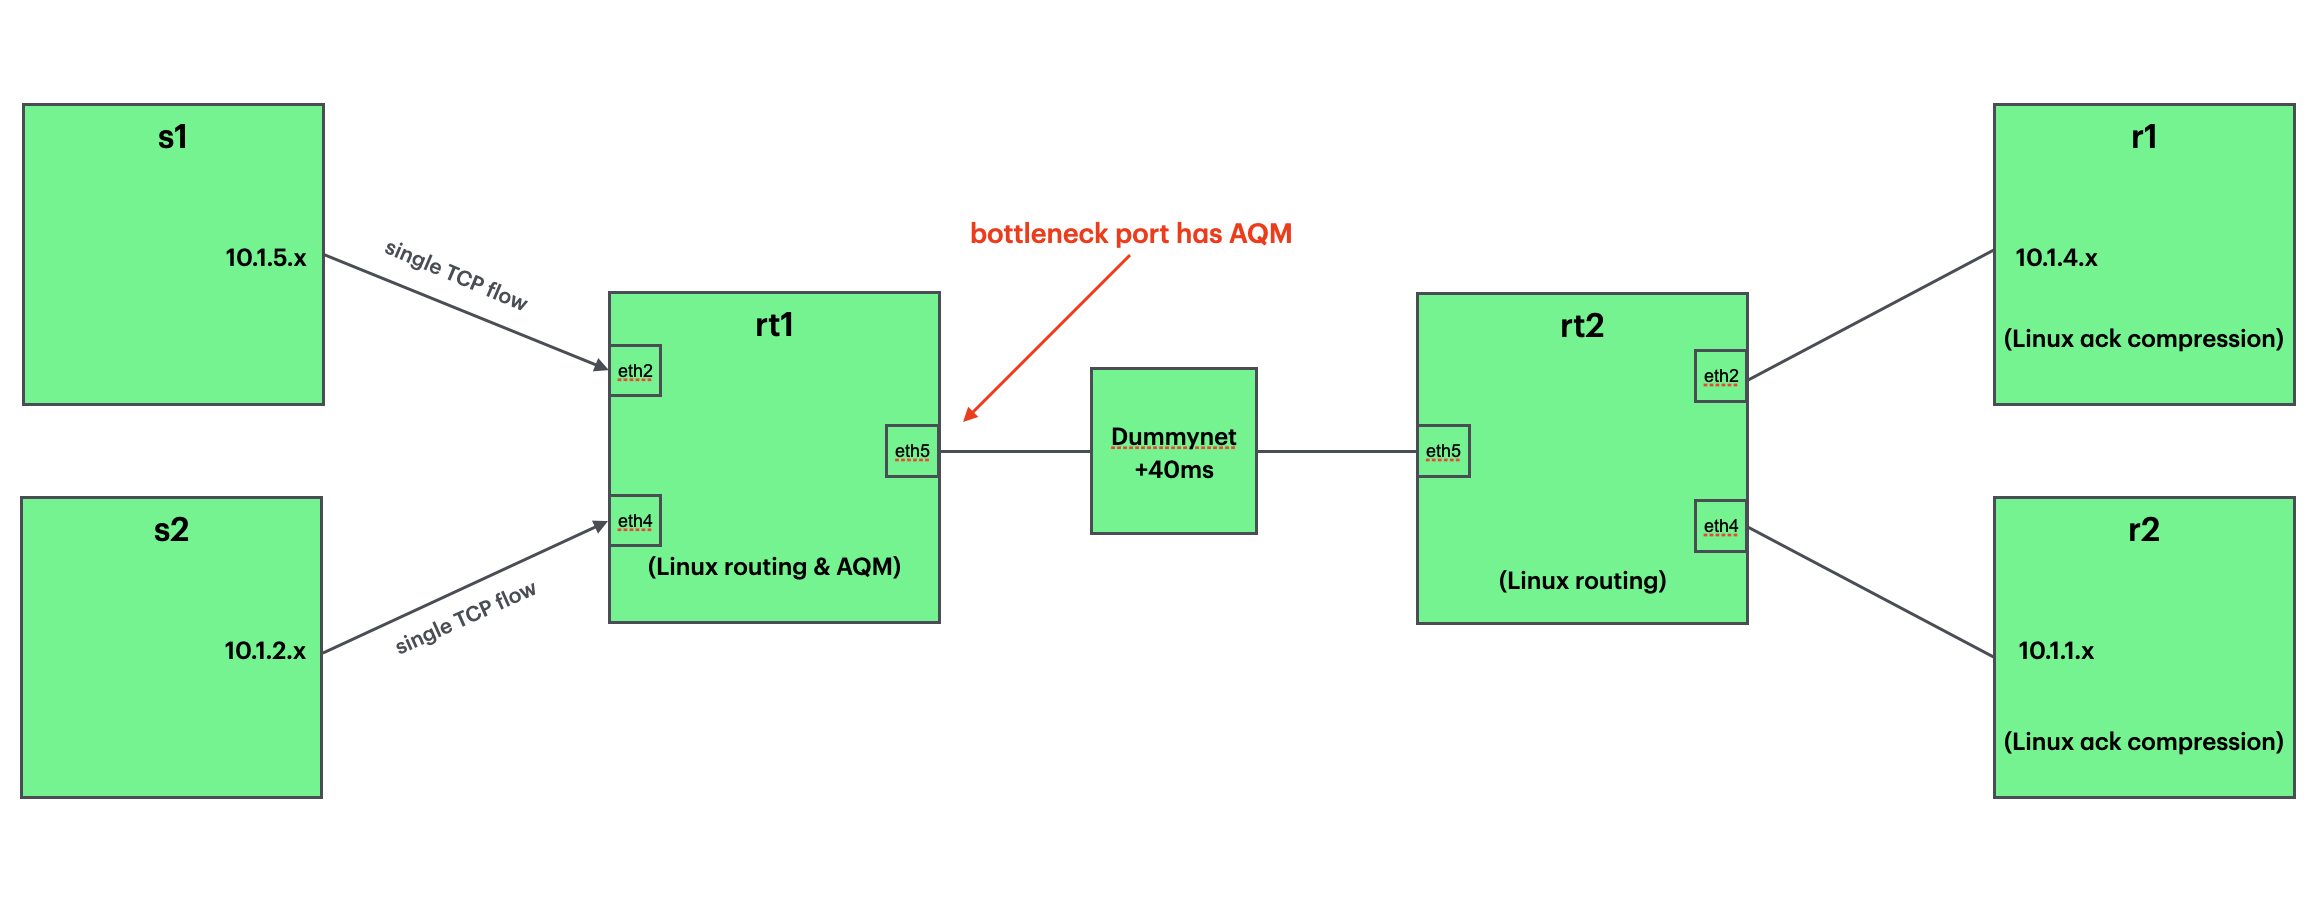
The topology is a dumbbell with nodes (s1, s2) acting as TCP traffic senders using iperf3, nodes (rt1, rt2) serving as routers with a single bottleneck link, and nodes (r1, r2) functioning as TCP traffic receivers. Nodes s1, s2 are running the OS targets, and nodes r1, r2 are running Ubuntu Linux 24.04 to take advantage of ACK compression. Router nodes rt1 and rt2 are running Ubuntu Linux 24.04, with NIC and Layer 3 tuning to optimize IP forwarding. For instance, the bottleneck interface can be configured with shallow L2 and L3 buffers totaling approximately 96 packets (48 for L2 and 48 for L3). A dummynet box introduces a 40ms round-trip delay (RTT) on the bottleneck link. Each sender transmits data to its corresponding receiver (e.g., s1 -> r1, s2 -> r2).
All the physical links have 1Gbps bandwidth. A middle box running Dummynet adds 40ms delay emulation that at least provides a 1000Mbps x 40ms == 5MB Bandwidth Delay Product(BDP) environment. So I configured sender/receiver with 10MB TCP buffer. Active Queueing Management (AQM) is applied on the bottleneck port of rt1.
- 40ms propagation delay and senders/receivers have 10MB buffer (200% BDP)
root@s1:~# ping -c 4 r1
PING r1-link5 (10.1.4.3) 56(84) bytes of data.
64 bytes from r1-link5 (10.1.4.3): icmp_seq=1 ttl=62 time=40.1 ms
64 bytes from r1-link5 (10.1.4.3): icmp_seq=2 ttl=62 time=40.0 ms
64 bytes from r1-link5 (10.1.4.3): icmp_seq=3 ttl=62 time=40.1 ms
64 bytes from r1-link5 (10.1.4.3): icmp_seq=4 ttl=62 time=40.0 ms

--- r1-link5 ping statistics ---
4 packets transmitted, 4 received, 0% packet loss, time 3005ms
rtt min/avg/max/mdev = 40.039/40.070/40.120/0.031 ms
root@s1:~#
root@s2:~# ping -c 4 r2
PING r2-link6 (10.1.1.3) 56(84) bytes of data.
64 bytes from r2-link6 (10.1.1.3): icmp_seq=1 ttl=62 time=40.2 ms
64 bytes from r2-link6 (10.1.1.3): icmp_seq=2 ttl=62 time=40.1 ms
64 bytes from r2-link6 (10.1.1.3): icmp_seq=3 ttl=62 time=40.1 ms
64 bytes from r2-link6 (10.1.1.3): icmp_seq=4 ttl=62 time=40.0 ms

--- r2-link6 ping statistics ---
4 packets transmitted, 4 received, 0% packet loss, time 3004ms
rtt min/avg/max/mdev = 40.033/40.107/40.214/0.071 ms
root@s2:~#

root@s1:~ # sysctl -f /etc/sysctl.conf
kern.log_console_output: 0 -> 0
net.inet.tcp.hostcache.enable: 0 -> 0
kern.ipc.maxsockbuf: 10485760 -> 10485760
net.inet.tcp.sendbuf_max: 10485760 -> 10485760
net.inet.tcp.recvbuf_max: 10485760 -> 10485760
root@s1:~ #

root@s2:~ # sysctl -f /etc/sysctl.conf
kern.log_console_output: 0 -> 0
net.inet.tcp.hostcache.enable: 0 -> 0
kern.ipc.maxsockbuf: 10485760 -> 10485760
net.inet.tcp.sendbuf_max: 10485760 -> 10485760
net.inet.tcp.recvbuf_max: 10485760 -> 10485760
root@s2:~ #

cc@r1:~ % sudo sysctl -p
net.ipv4.tcp_no_metrics_save = 1
net.core.rmem_max = 10485760
net.core.wmem_max = 10485760
net.ipv4.tcp_rmem = 4096 131072 10485760
net.ipv4.tcp_wmem = 4096  16384 10485760
cc@r1:~ %

cc@r2:~ % sudo sysctl -p
net.ipv4.tcp_no_metrics_save = 1
net.core.rmem_max = 10485760
net.core.wmem_max = 10485760
net.ipv4.tcp_rmem = 4096 131072 10485760
net.ipv4.tcp_wmem = 4096  16384 10485760
cc@r2:~ %
- iperf3 commands
receiver: iperf3 -s -p 5201 --affinity 1
sender:   iperf3 -B ${src} --cport ${tcp_port} -c ${dst} -p 5201 -l 1M -t 300 -i 1 -f m -VC ${name}
FreeBSD s1 & s2 info |
FreeBSD 15.0-CURRENT (GENERIC) #0 main-d4763484f911: Mon Apr 21 2025 |
Linux r1 & r2 info |
Ubuntu 24.04.2 LTS (GNU/Linux 6.8.0-53-generic x86_64) |
Linux rt1 & rt2 info |
Ubuntu 24.04.2 LTS (GNU/Linux 6.8.0-53-generic x86_64) with rx/tx driver and qdisc tuning for IP forwarding performance |
link utilization under two competing TCP flows
need to mention about the Linux qdisc on dropping packets in the bottleneck port, for example after 300 seconds of two competing TCP flows traffic:
root@rt1:~# tc -s qdisc show dev eth2
qdisc pfifo 8007: root refcnt 2 limit 256p
 Sent 105132572 bytes 1592669 pkt (dropped 0, overlimits 0 requeues 8)
 backlog 0b 0p requeues 8
root@rt1:~# tc -s qdisc show dev eth4
qdisc pfifo 8009: root refcnt 2 limit 256p
 Sent 119886021 bytes 1816294 pkt (dropped 0, overlimits 0 requeues 3)
 backlog 0b 0p requeues 3
root@rt1:~# tc -s qdisc show dev eth5
qdisc pfifo 800a: root refcnt 2 limit 48p
 Sent 20842988722 bytes 13766899 pkt (dropped 789, overlimits 0 requeues 58847)  <<< bottleneck drops
 backlog 0b 0p requeues 58847
root@rt1:~#
link utilization of two competing TCP flows under a bottleneck of rx/tx=48p and qdisc pfifo mode =48p (MTU=1500: L2+L3 buffer = 96 packets = 140KB = 0.27%BDP), all the other router ports are using the default rx/tx=256p and qdisc pfifo=256p
TCP CC |
version |
flow1 average throughput |
flow2 average throughput |
link utilization: average(flow1 + flow2) |
TCP fairness |
comment |
CUBIC in freebsd default stack |
before patch |
92.5 Mbits/sec |
101.0 Mbits/sec |
193.5 Mbits/sec |
99.8% |
base |
after patch |
199.0 Mbits/sec |
211.0 Mbits/sec |
410.0 Mbits/sec |
99.9% |
+111.9% |
|
NewReno in freebsd default stack |
15-CURRENT |
95.4 Mbits/sec |
83.9 Mbits/sec |
179.3 Mbits/sec |
99.6% |
|
|
||||||
CUBIC in freebsd RACK stack |
before patch |
122.0 Mbits/sec |
129.0 Mbits/sec |
251.0 Mbits/sec |
99.9% |
base |
after patch |
117.0 Mbits/sec |
129.0 Mbits/sec |
246.0 Mbits/sec |
99.8% |
-2.0% |
|
NewReno in freebsd RACK stack |
15-CURRENT |
95.1 Mbits/sec |
106.0 Mbits/sec |
201.1 Mbits/sec |
99.7% |
|
|
||||||
CUBIC in Linux |
kernel 6.8.0 |
304.0 Mbits/sec |
222.0 Mbits/sec |
526.0 Mbits/sec |
97.6% |
reference |
NewReno in Linux |
kernel 6.8.0 |
199.0 Mbits/sec |
247.0 Mbits/sec |
446.0 Mbits/sec |
98.9% |
reference |


